O.D.: Optical Density
 |
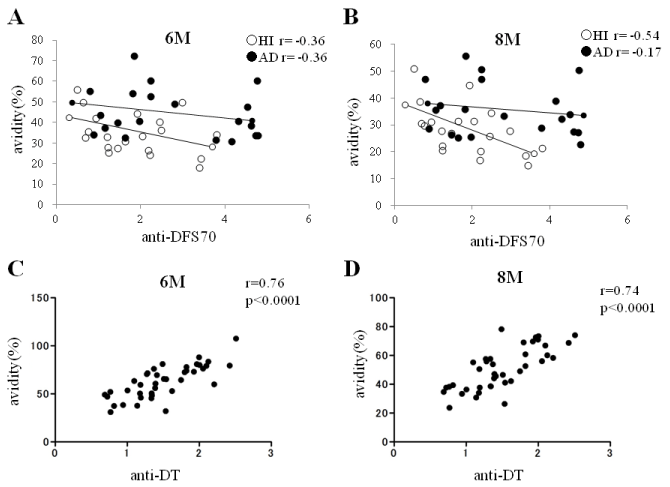
| Figure 2: There is no correlation between the serum level and the avidity of anti-DFS70 in AD: The serum level and avidity of anti-DFS70 (A and B) and anti-DT
(C and D) are plotted for 6 M (A and C) and 8 M (B and D) urea treatment in the ELISAs. In (A) and (B), open and filled circles represents HI and AD patients,
respectively. O.D.: Optical Density |