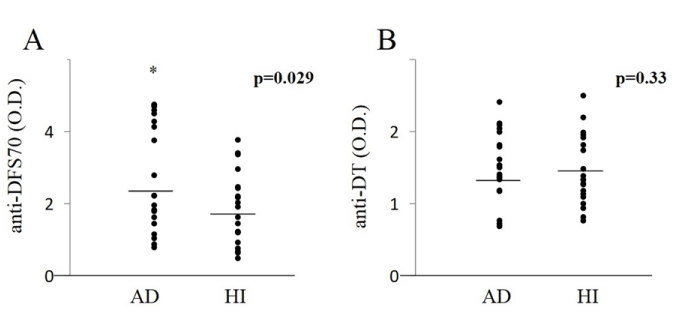
O.D.: Optical Density
 |
| Figure 3: Antibody levels of and-DFS70 and anti-DT in the AD and HI groups:
The anti-DFS70 level is significantly lower (p=0.029) in the HI. The horizontal
line represents the mean. Differences were analyzed by Mann-Whitney U-test,
and statistically significant differences are indicated (*p<0.05). O.D.: Optical Density |