 |
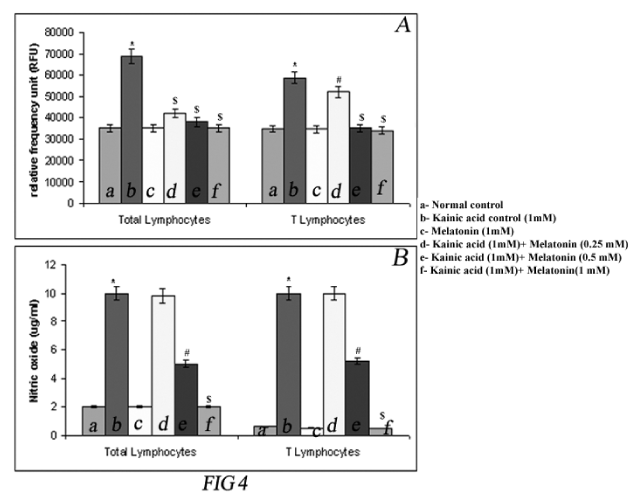
| Figure 4: (A) Dichloro-dihydro-fluorescein diacetate (DCFH-DA) assay to assess the counter effect of melatonin on ROS production induced by kainic acid on splenic lymphocytes and enriched T lymphocytes isolated from mouse spleen. (a) Normal control, (b) Kainic acid control (1 mM), (c) Melatonin (1 mM), (d) Kainic acid (1 mM)+Melatonin (0.25 mM), (e) Kainic acid (1 mM)+Melatonin (0.5 mM), (f) Kainic acid (1 mM)+Melatonin (1 mM). Values are mean ± S.D; *P<0.005 (compared to respective normal control); #P<0.05 (compared to Kainic acid control) and $P<0.005 (compared to Kainic acid control). n=3 in each group. (B) Determination of Nitrite production (RNS) by Griess reagent induced by kainic acid on splenic lymphocytes and enriched T lymphocytes isolated from mouse spleen and its counter effect by melatonin treatment. (a) Normal control, (b) Kainic acid control (1 mM), (e) Melatonin (1 mM), (d) Kainic acid (1 mM)+Melatonin (0.25 mM), (e) Kainic acid (1 mM)+Melatonin (0.5 mM), (f) Kainic acid (1 mM)+Melatonin (1 mM). Values are mean ± S.D; *P<0.005 (compared to respective normal control); #P<0.05 (compared to Kainic acid control) and $P<0.005 (compared to Kainic acid control). n=3 in each group. |