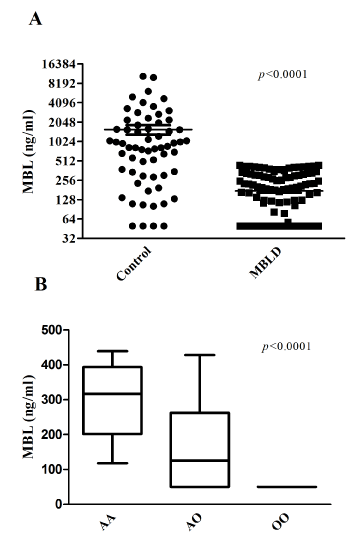
Figure 1:
(A) Distribution of MBL levels in control subjects (n=63) and MBLD subjects (n=120). (B) Distribution of MBL levels of the MBL2 genotypes within the MBLD cohort.