 |
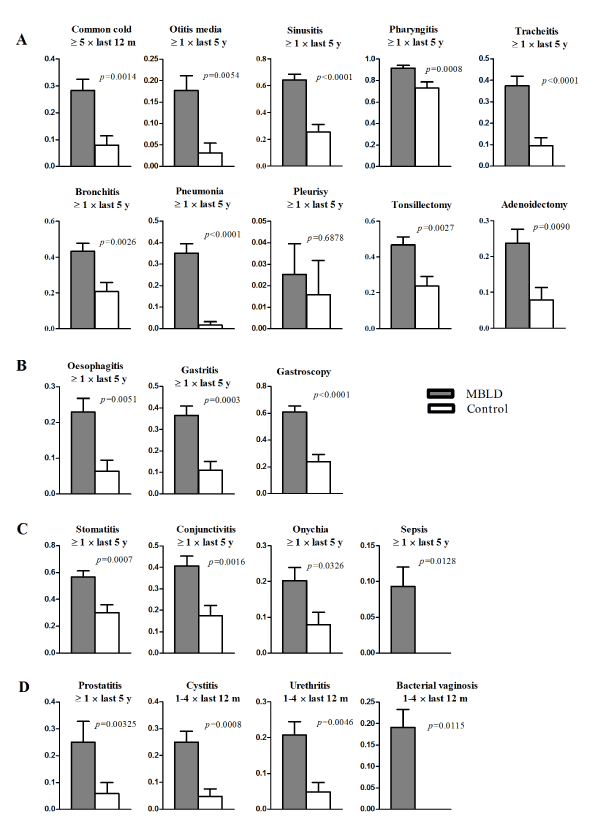
| Figure 2: MBLD individuals (n=120) are more prone to various infections than controls (n=63). (A) Occurence of respiratory tract infections. (B) Occurrence of gastrointestinal infections. (C) Occurrence of mucosa, cutaneous and blood infections. (D) Occurrence of urogenital infections. Reported occurrence over time interval is indicated in each graph. The Y-axis represents number of individuals (as percent of n) [y: years; m: months]. |