 |
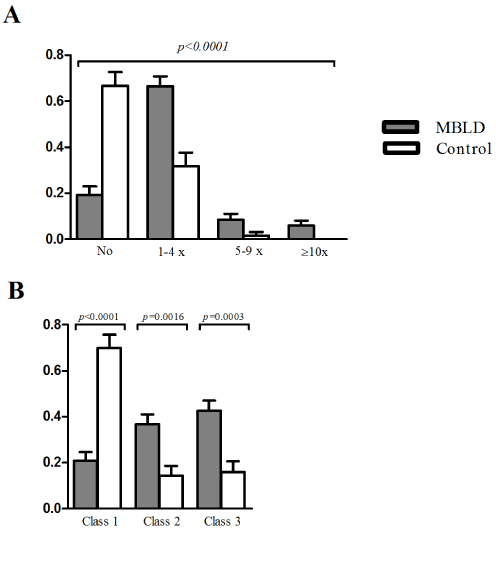
| Figure 3: (A) Antibiotic use among the MBLD individuals (n=120) and controls (n=63). Use of antibiotics the last 12 months is shown. The X-axis represents the number of systemic antibiotic treatments. The Y-axis represents the number of individuals (as percent of n). (B) MBLD individuals are highly susceptible to recurrent and severe infections. The reported frequencies of different types of infections were classified into three classes (incremental infection proneness and severity from 1 to 3) [42]. |