 |
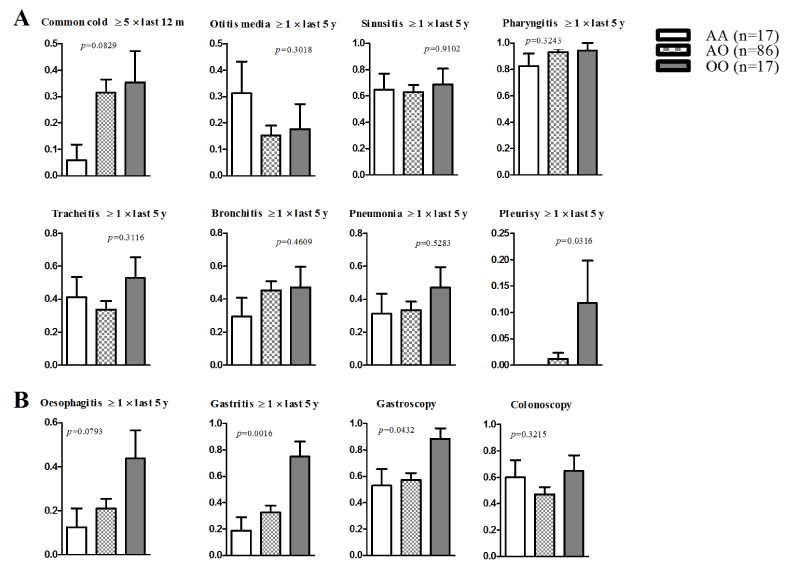
| Figure 4: O/O genotype is a potential risk factor for gastritis. (A) Comparison of occurrence of respiratory tract infections between MBL2 genotypes within the MBLD cohort (n=120). (B) Comparison of occurrence of gastrointestinal symptoms between MBL2 genotypes. Reported occurrence over time interval is indicated in each graph. The Y-axis represents the number of individuals in each genotype group of the MBLD cohort (as percent of n) [y: years; m: months]. |