 |
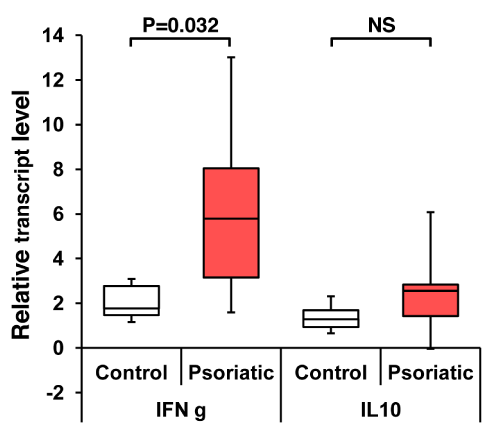
| Figure 1: Expression of Th-specific cytokines in control and psoriatic PBMC. Quantitative RT-PCR was performed on total mRNA extract from 9 and 11 PBMC from control and psoriatic PBMC respectively, as detailed in Materials and Methods; each sample was assayed at least in duplicate and the averaged values used for the box-plot representation. The bottom and top of the box indicate the first and third quartile respectively, the band inside the box is the median and the ends of the whiskers are one standard deviation above and below the mean of the data. White boxes, control; red boxes, psoriatic. Statistically significant differences are shown when P<0.05; NS, nonstatistically significant (i.e. P>0.05). |