 |
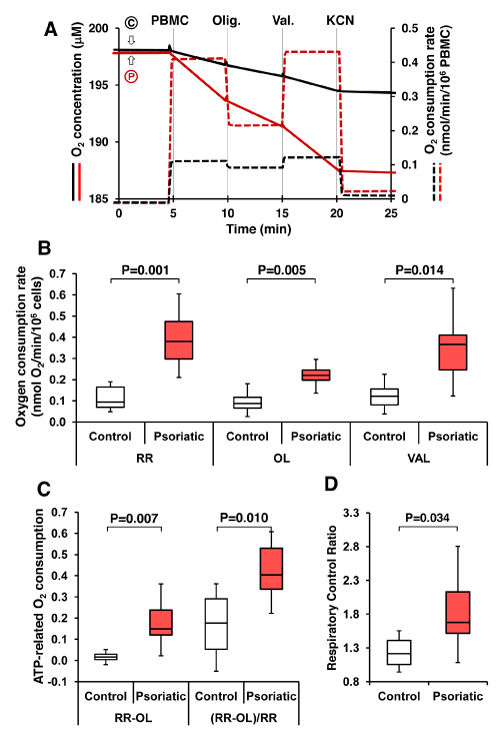
| Figure 2: Measurement of mitochondrial respiratory activities in control and psoriatic intact PBMC. (A) Representative oxymetric traces of mitochondrial respiration in PMBC from one control ((C), control #8), black lines) and one psoriatic ((P), patient #6), red lines), respectively. The measurements were carried out simultaneously in 2 ml tween chambers as detailed in Materials and Methods. Where indicated the following was added: 4×10⁶ PBMC, 8 μg/ ml oligomycin (olig), 2 μg/ml valinomycin (val), 3 mM KCN. The continuous and dashed lines represent the O2 concentration (left axis) and the oxygen consumption rate (right axis, OCR normalized to cell number) measured simultaneously every 0.1 s throughout the time-course of the assay. (B) Boxplot representation of the normalized and KCN-insensitive-corrected oxygen consumption rates measured under resting conditions (RR), in the presence of oligomycin (OL) and in the presence of valinomycin (VAL) (see panel A). The plots were constructed from the average values of 2-3 independent measurements for each control or psoriatic PBMC sample. (C) ATP-dependent O2 consumption measured as absolute difference between that obtained in the absence and that in the presence of oligomycin (RR-OL) or normalized to the basal respiration ((RR-OL)/RR). (D) Respiratory control ratios obtained dividing the oxygen consumption rates measured under resting conditions by that in the presence of oligomycin (RR/OL). White boxes, control; red boxes, psoriatic. The statistical significance between related pairs of measurements in control and psoriatic samples is shown as P. |