 |
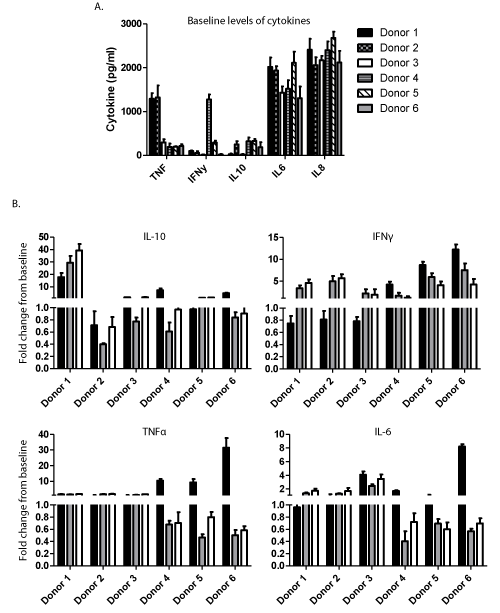
| Figure 7: GA induces differential cytokine profiles from MS patients B cells. B lymphocytes were purified from MS patients and stimulated with anti-IgM and anti-CD40, GA or GA and anti-CD40. Culture supernatants were collected at 24, 48 and 72 hours post stimulation. All cytokine data shown is 48 hours post stimulation, as this was the most robust response. (A) Baseline levels of the indicated cytokines from 48 hour culture supernatants of unstimulated B cells. (B) Fold change from baseline in B cell cytokine levels with anti-IgM and anti- CD40 stimulation (solid black bars), GA stimulation (solid grey bars), or GA and anti-CD40 stimulation (white bars). |