 |
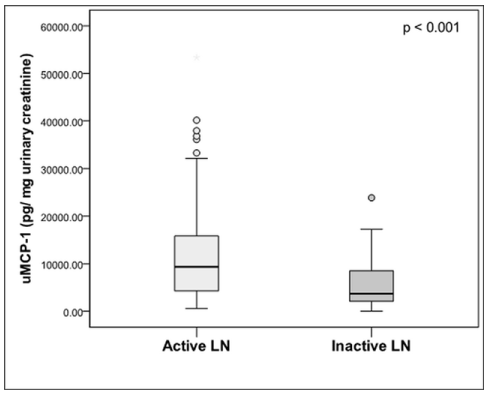
| Figure 1: uMCP-1 levels in patients with and without active lupus nephritis (LN). The horizontal line across the boxes represent the median value of uMCP-1 levels among patient groups: the areas between the upper and lower limits of boxes represent the interquartile range; the vertical lines protruding from the box represent the maximum and minimum values of uMCP-1 levels respectively. uMCP-1 levels were significantly higher in patients with active LN compared to those with inactive LN (p=0.001). |