|
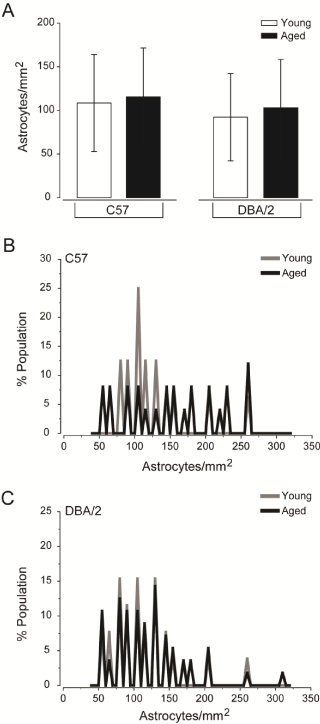
| Figure 2: Glaucoma-related stressors alter astrocyte distribution rather than total density. (A) Quantification of the mean density of astrocytes (astrocytes/ mm2; y-axis) across all images and samples reveals no difference in the overall density of astrocytes in retina challenged by glaucoma-related stressors, as compared to healthy retina. Error bars indicate standard deviation and asterisks indicate p<0.05. (B) Histogram function of astrocyte density for young C57 (gray) and aged C57 (black) retina plotted as percent population (y-axis) versus astrocytes/mm2 (x-axis). The histogram functions reveal a larger spread in the distribution of astrocyte densities in aged C57 retina, as compared to healthy retina. (C) Histogram function of astrocyte density for young DBA/2 (gray) and aged DBA/2 (black) retina plotted as percent population (y-axis) versus astrocytes/mm2 (x-axis). The histogram functions reveal a larger spread in both distributions, as compared to young C57 retina (B) However, aged DBA/2 retina exhibits a larger spread in the distribution than young DBA/2 retina. |