 |
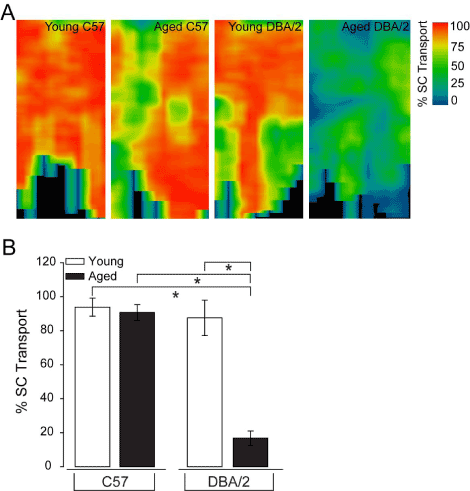
| Figure 8: Glaucoma induces severe deficits in anterograde axonal transport by RGCs. (A) Representative, two-dimensional spatial maps of CTB labeling across entire retinotopic region of one lobe of the superior colliculus from young C57, aged C57, young DBA/2 and aged DBA/2 mice. Color bar indicates percent of CTB transport to the superior colliculus (% SC Transport), where blue is 0% and red is 100%. Collicular maps from aged C57 and young DBA/2 mice reveal some sectorial decreases in CTB transport, but with a majority of the map demonstrating full transport. In contrast, aged DBA/2 retina exhibits drastic reduction in CTB transport that is also sectorial in nature. (B) Quantification of mean percent of CTB transport in the superior colliculus (% SC Transport; y-axis) reveals that CTB transport to the colliculus is severely compromised in aged DBA/2 mice, as compared to young C57, aged C57 and young DBA/2 mice. Error bars represent ± standard deviation and asterisks indicate p<0.05. |