 |
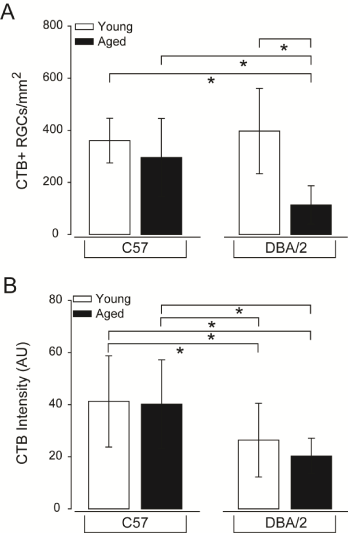
| Figure 9: RGC health, as measured by active uptake of neural tracer, is severely compromised in glaucomatous retina. (A) Quantification of the density of RGCs with any level of CTB uptake above background levels represented as the density of CTB+ RGCs/mm2. Aged DBA/2 retina exhibits a highly significant decrease in the density of RGCs with detectable uptake of the neural tracer CTB, as compared to young C57, aged C57 and young DBA/2 mice. Error bars represent ± standard deviation and asterisks indicate p<0.05. (B) Quantification of total CTB labeling intensity (arbitrary units; y-axis) reveals that while there is no significant reduction in the density of CTB+ RGCs in young DBA/2 retina, RGCs in both young DBA/2 and aged DBA/2 retina exhibit reduced uptake of CTB. Error bars represent ± standard deviation and asterisks indicate p<0.05. |