 |
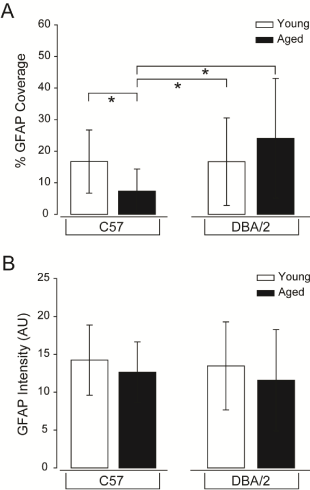
| Figure 11: Percent of the retinal area covered by astrocytes is a viable index for glaucoma-induced changes in astrocyte microdomains. (A) Quantification of the percent of retinal area covered by astrocytes in 200 mm×200 mm microdomains, represented as % GFAP coverage (y-axis) reveals that normal aging induces a substantial decrease in astrocyte coverage, as compared to young C57 and young DBA/2 retina. In contrast, glaucomatous retina (aged DBA/2) demonstrates a greater than 3-fold increase in astrocyte coverage than its age-matched C57 control. Error bars represent ± standard deviation and asterisks indicate p<0.05. (B) Quantification of total GFAP labeling intensity (arbitrary units; y-axis) reveals that there is no significant difference in overall GFAP expression between conditions. Error bars represent ± standard deviation and asterisks indicate p<0.05. |