 |
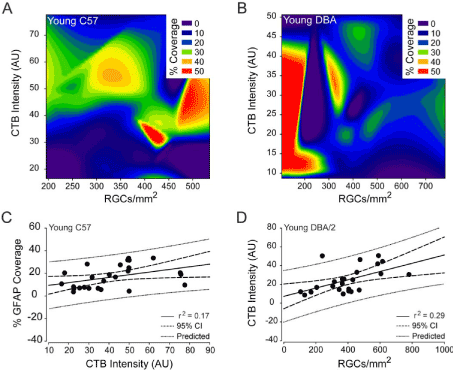
| Figure 12: Percent coverage of retinal area by astrocytes is not a strong predictor of RGC health in young C57 or young DBA/2 retina. (A and B) Contour plot depicting the spatial relationships between percent coverage of retinal area by astrocytes (color bar; % coverage), CTB+ RGC density (x-axis; CTB+ RGCs/mm2) and total CTB intensity (y-axis; arbitrary units) in young C57 (A) and young DBA/2 (B) retina. (C) Regression graph of the positive correlation between total CTB intensity and percent coverage of retinal area by astrocytes in young C57 retina plotted as arbitrary units of intensity (x-axis) versus % GFAP coverage (y-axis). Solid lines indicate regression line based on r2 value. Dashed lines indicate the 95% confidence interval. Dotted lines indicate predicted values based on r2 and 95% confidence. (D) Regression graph of the positive correlation between CTB+ RGC density and total CTB intensity in young DBA/2 retina plotted as CTB+ RGCs/mm2 (x-axis) versus arbitrary units of intensity (y-axis). Solid lines indicate regression line based on r2 value. Dashed lines indicate the 95% confidence interval. Dotted lines indicate predicted values based on r2 and 95% confidence. |