 |
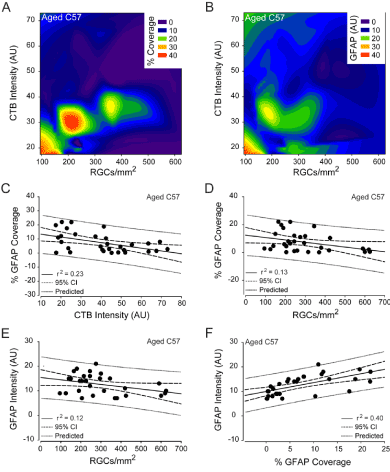
| Figure 13: Astrocyte reactivity predicts RGC health in normal aging. (A) Contour plot depicting the spatial relationships between percent coverage of retinal area by astrocytes (color bar; % coverage), CTB+ RGC density (x-axis; CTB+ RGCs/mm2) and total CTB intensity (y-axis; arbitrary units) in aged C57 retina. (B) Contour plot depicting the spatial relationships between total GFAP intensity (color bar; GFAP (AU)), CTB+ RGC density (x-axis; CTB+ RGCs/mm2) and total CTB intensity (y-axis; arbitrary units) in aged C57 retina. (C) Regression graph of the negative correlation between total CTB intensity and percent coverage of retinal area by astrocytes in aged C57 retina plotted as arbitrary units of intensity (x-axis) versus % GFAP coverage (y-axis). (D) Regression graph of the negative correlation between CTB+ RGC density and percent coverage of retinal area by astrocytes in aged C57 retina plotted as CTB+ RGCs/mm2 (x-axis) versus % GFAP coverage (y-axis). (E) Regression graph of the negative correlation between CTB+ RGC density and total GFAP intensity in aged C57 retina plotted as CTB+ RGCs/mm2 (x-axis) versus arbitrary units of GFAP intensity (y-axis). (F) Regression graph of the positive correlation between percent coverage of retinal area by astrocytes and total GFAP intensity in aged C57 retina plotted as % GFAP coverage (x-axis) versus arbitrary units of GFAP intensity (y-axis). For all graphs, solid lines indicate regression line based on r2 value. Dashed lines indicate the 95% confidence interval. Dotted lines indicate predicted values based on r2 and 95% confidence. |