 |
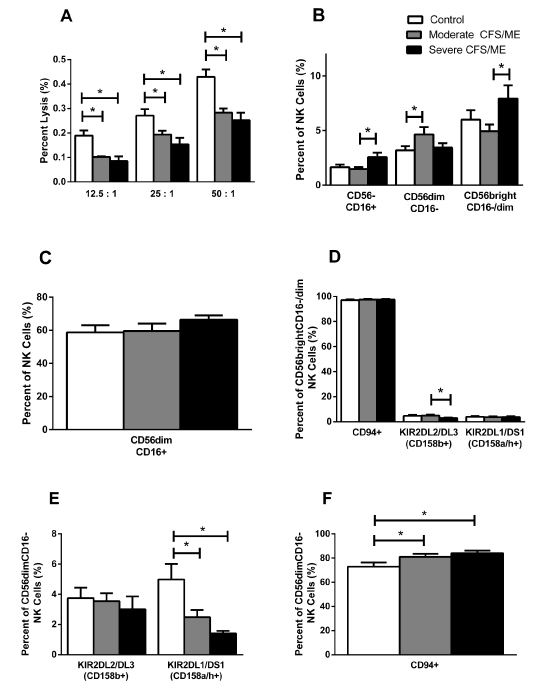
| Figure 1: The profile of NK cells in control, moderate and severe CFS/ME. (A)K cell cytotoxic activity was measured at 12.5:1, 25:1 and 50:1 effector to target cell ratios. Data is presented as percentage of K562 target cells lysed by NK cells. (B) NK cell phenotypes (CD56-CD16+, CD56dimCD16- and CD56brightCD16-/dim) presented as a percentage of total NK cells. (C) NK cell phenotype CD56dimCD16+presented as a percentage of total NK cells. (D) CD56brightCD16-/dim NK cells expressing KIR receptors CD94+, KIR2DL2/DL3 and KIR2DL1/DS1are represented as a percentage of total CD56brightCD16-/dim NK cells. (E) CD56dimCD16- NK cells expressing the KIR receptors KIR2DL2/DL3 and KIR2DL1/DS1 are represented as a percentage of CD56dimCD16- NK cells. (F) CD56dimCD16- NK cells expressing the KIR receptor CD94+ represented as a percentage of CD56dimCD16- NK cells. All data is represented as mean ± SEM. *represents results that were significantly different where p<0.05. NK: Natural Killer; KIR: Killer Immunoglobulinlike Receptor; CFS/ME: Chronic Fatigue Syndrome/Myalgic Encephalomyelitis; SEM: Standard Error of the Mean. |