 |
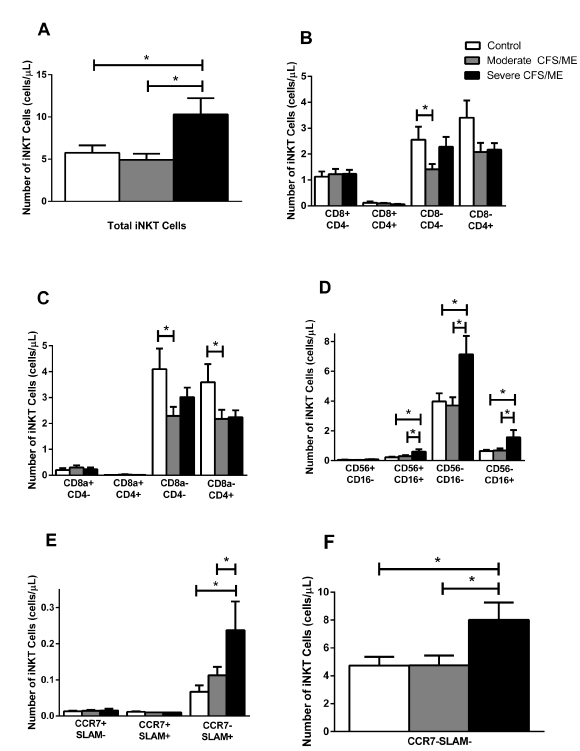
| Figure 3: Perturbations in iNKT cell phenotypes and receptors in control, moderate and severe CFS/ME. (A) Total iNKT cell numbers are represented as a total number of cells (cells/μL) in control, moderate and severe CFS/ME groups. (B) CD8 and CD4 iNKT cell phenotypes represented as total number of cells (cells/μL). (C) CD8a and CD4 iNKT cell phenotypes are represented as total number of cells (cells/μL). (D) CD56 and CD16 iNKT cell phenotypesare represented as total number of cells (cells/μL). (E) CCR7 and SLAM iNKT cell receptor expression (CCR7+SLAM-, CCR7+SLAM+ and CCR7-SLAM+) is shown as total number of cells (cells/μL). (F) CCR7 and SLAM iNKT cell receptor expression (CCR7+SLAM-) is represented as total number of cells (cells/μL). All data is represented as mean ± SEM. *represents results that were significantly different where p < 0.05 CFS/ME: Chronic Fatigue Syndrome/Myalgic Encephalomyelitis; CCR7: C Chemokine Receptor Type 7; SLAM: Signaling Lymphocytic Activation Molecule; SEM: Standard Error of the Mean. |