 |
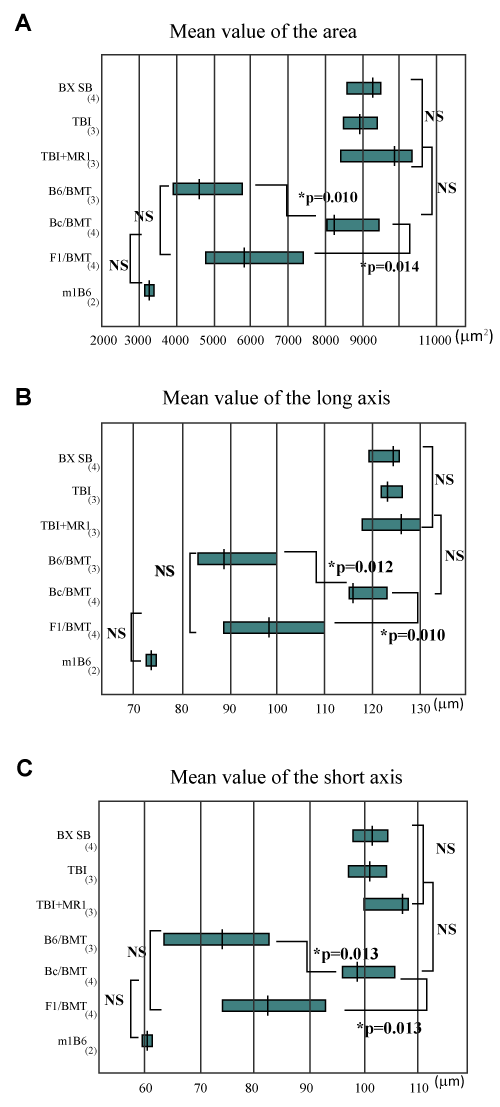
| Figure 5: Comparison of size of glomeruli between the seven experimental groups. (A) The mean value of the area of the glomeruli, (B) the long-axis of the glomeruli, (C) and the short-axis of the glomeruli. Results are shown as mean ± SD for each group. NS: No Significant difference. |