 |
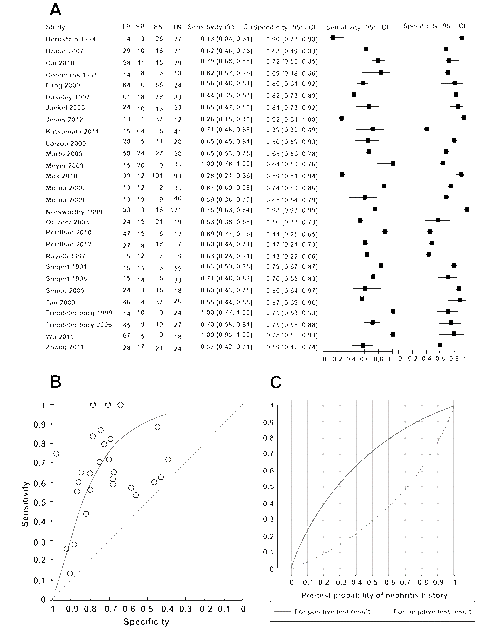
| Figure 4: Comparing anti-C1q between patients with and without a history of lupus nephritis. (A) Coupled forest plot of sensitivity and specificity of anti-C1q for distinguishing between patients with and without a history of LN. The sensitivity and specificity values for each individual study are shown (squares) with 95% confidence intervals (horizontal lines). TP – true positives; FP – false positives; FN – false negative; TN – true negatives. (B) Summary ROC plot summarizing sensitivity and specificity of anti-C1q for distinguishing between patients with and without a history of LN. Summary ROC curve based on the fitted HSROC random effects model is shown. Each circle represents an individual study. Points above the diagonal line indicate that the test has better classification than random assignment to a positive or negative test result. (C)Post-test probability of LN history versus pre-test probability. Separate curves shown based on a positive anti-C1q result and a negative anti-C1q result. |