 |
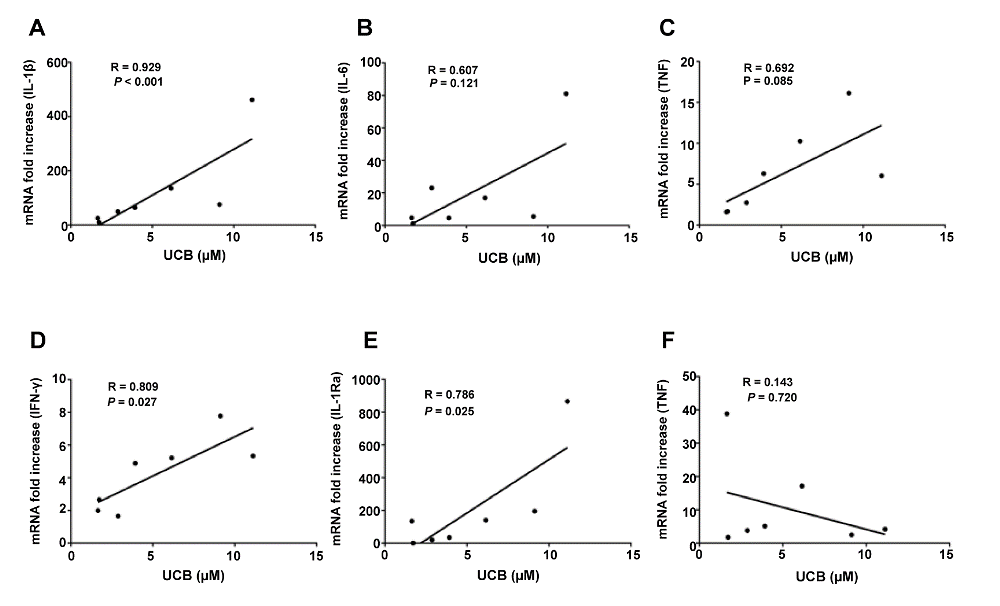
| Figure 3: UCB concentration and cytokine gene expression in response to LPS. Whole blood was incubated with BV and LPS for 4 hours and mRNA expression was assessed. Figure shows scatter plots and the correlation between baseline UCB concentration and cytokine gene expression (A-F), n=7. |