|
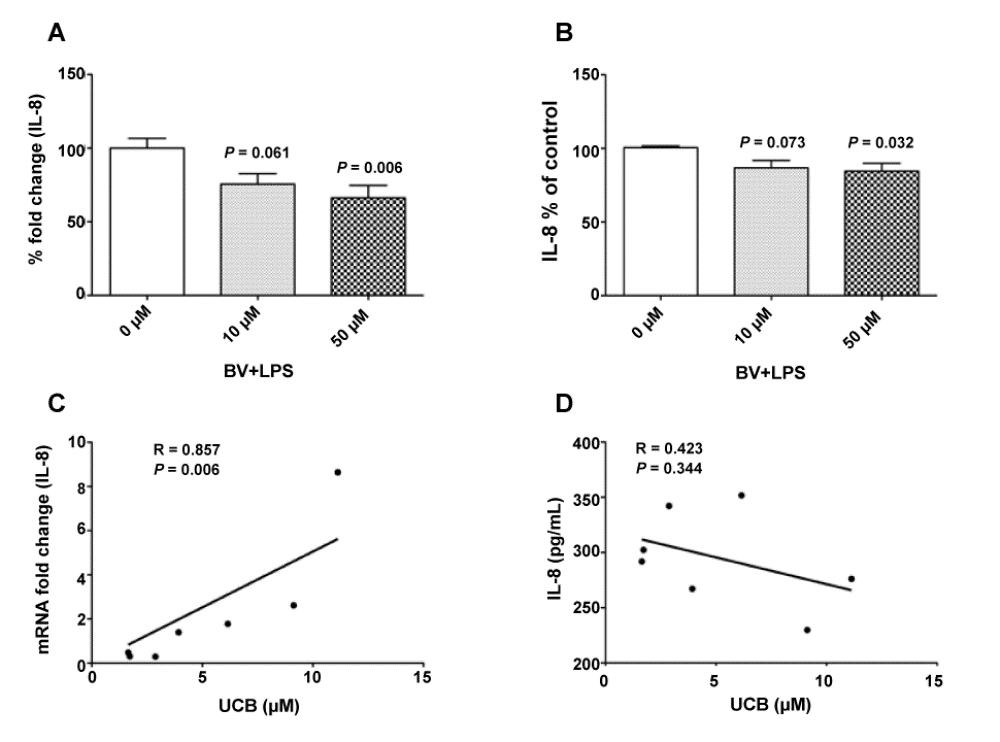
| Figure 6: IL-8 concentration in response to LPS and BV. IL-8 gene and protein concentration was analysed using qPCR and high sensitivity ELISA kit, respectively in blood samples incubated with BV and LPS for 8 hours. IL-8 gene expression (A) and plasma release (B) in response to BV + LPS. Data are presented as mean ± S.E. n=7 and P < 0.05 vs. sample treated with LPS only (0 μM). Scatter plot showing the correlation between baseline UCB concentration and IL-8 gene (C) and protein expression (D) in response to LPS, n=7. |