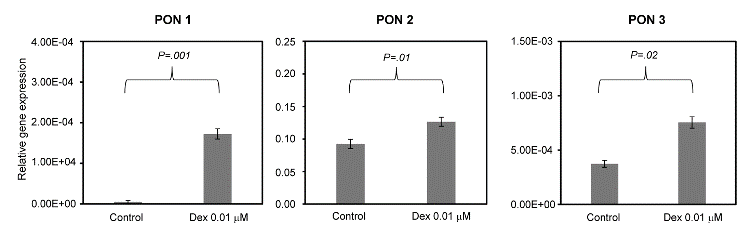
Figure 3:
Relative gene expression in Caco-2 cells treated with 0.01 μM dexamethasone vs. control cells treated with the dexamethasone vehicle, 1 μl ethanol. Values presented are copy numbers of PON mRNA per copy number of GAPDH mRNA.