 |
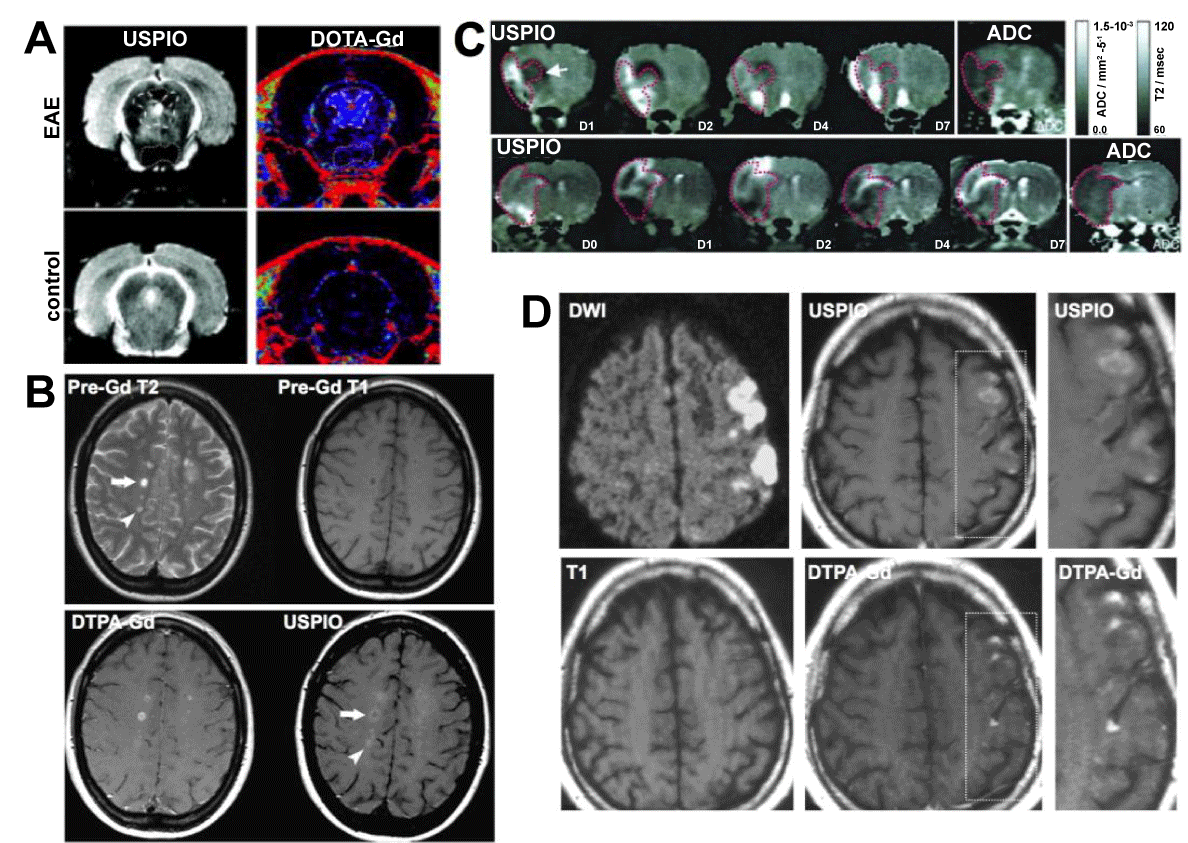
| Figure 8: Imaging of phagocytic cells with iron oxide-enhanced MR imaging. (A) USPIO and DOTA-Gd-enhanced MR imaging of EAE rats. A periventricular lesion shows DOTA-Gd enhancement but not USPIO uptake. Vice versa, a ventral lesion shows USPIO uptake but no DOTA-Gd enhancement. No enhancement is seen in a control animal. (B) Pre-Gd T2 MRI on a MS patient demonstrates multiple lesions, and while there is a DTPA-Gd and USPIO enhancing lesions (arrow), there also is an USPIO-uptake-only lesion (arrowhead). (C) Spatiotemporal profile of USPIO uptake in the ischemic rat brain over 7 days. While USPIO uptake is first seen in the periphery of the infarct (ADC map), uptake becomes more central on the following days, while no uptake is seen on day 7. (D) Comparison of USPIO and DTPA-Gd in a patient with ischemic stroke. Diffusion-weighted imaging displays ischemic area. Areas of USPIO uptake are clearly different from gadolinium enhancement. (Modified from Rausch et al. [10,171], Vellinga et al. [166] and Saleh et al. [173] with permission.) |