 |
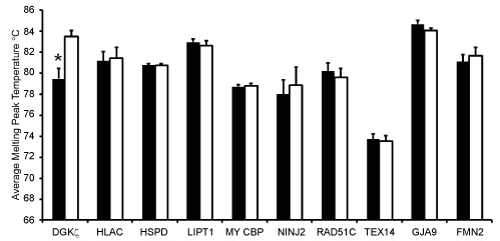
| Figure 2: HRM Validation of some methylated genes in the CD4+T cells from the CFS/ME patients and controls. The bar graphs represent the average melting temperatures of the genes examined, where the black bars are results from the CFS/ME patients and the white bars are results from the controls. * denotes significance at pvalue <0.05. |