|
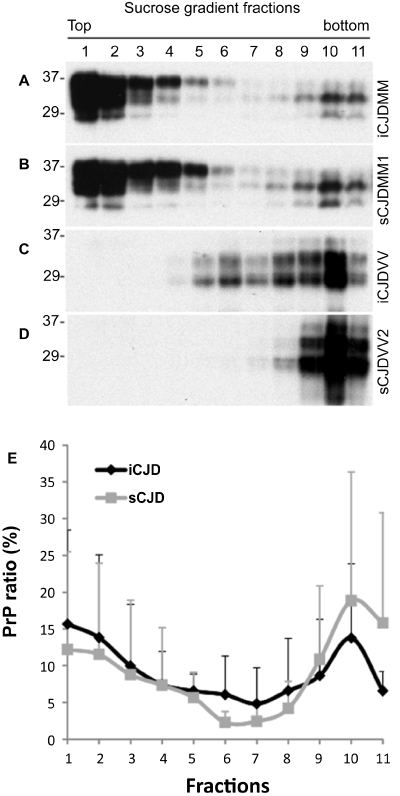
| Figure 2: Analysis of PrP oligomeric state by sucrose step gradient sedimentation. (A through D) Western blot analysis of PrP in different fractions of sucrose step gradient sedimentation. After ultracentrifugation of PrP in sucrose step gradients, 11 fractions were collected from the top of the gradients. PrP in individual fractions was detected by Western blotting with 3F4, which was subjected to densitometric analysis. (A) iCJDMM1; (B) sCJDMM1; (C) iCJDVV2; (D) sCJDVV2. PrP recovered in the top fractions 1-3 mainly represents monomers or small oligomers while PrP recovered in the bottom fractions 9-11 represents larger aggregates. (E) Ratio of PrPSc in each fraction to total PrP in all 11 fractions quantitated by densitometric analysis. No significant differences in PrP distribution profile were detected between iCJD (n=5) and sCJD (n=5). |