|
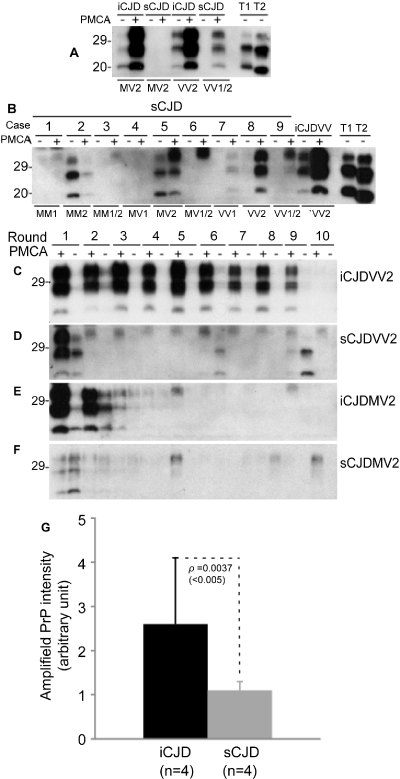
| Figure 5: Conformational stability immunoassay ofPrPSc. (A) and (B) Western blots of PKresistantPrPSc recovered from brain homogenates (A, iCJD; B, sCJD) following treatment with increasing concentrations of GdnHCl. (C) Levels of PK-resistantPrPSc from iCJD or sCJD as a function of increasing concentrations of GdnHCl. The dotted line represents PrP at 50% percentage of total PrP and corresponding concentration of GdnHCl (GdnHCl1/2). There was no significant difference in GdnHCl1/2 between iCJD (n=3) and sCJD (n=3). |