 |
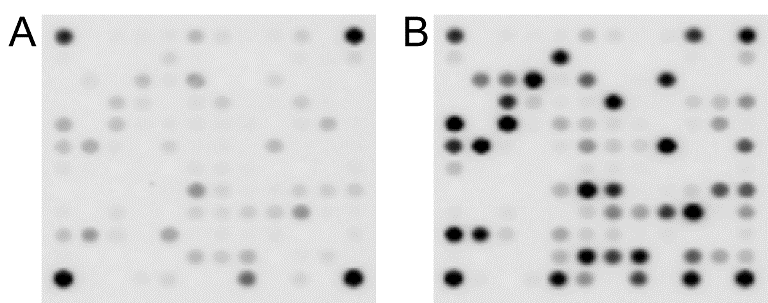
| Figure 1: Phosphorylation of peptides on PamChip by protein lysate derived from post-mortem human brain tissue, either (A) in the absence of ATP and (B) in the presence of 500 μM ATP. Shown are profiles obtained from a representative AD case. The Phosphorylation profile is seen as fluorescent spots (black) on a white background. In each corner a specific phosphorylated peptide is spotted as a reference and internal assay control. |