|
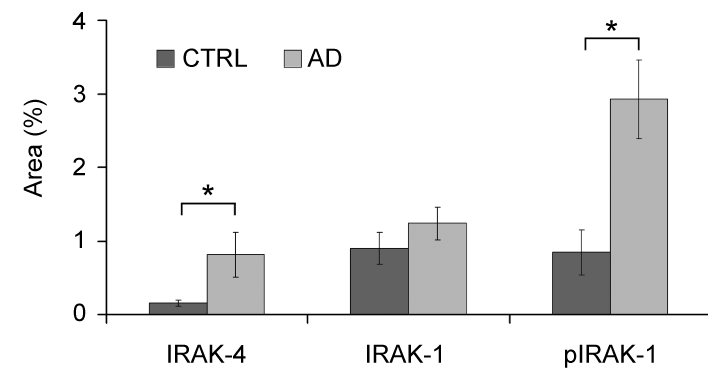
| Figure 3: Quantification of IRAK-4, IRAK-1 and pIRAK-1 in CTRL and AD temporal cortex. Mean levels (± SD) of the area density expressed as percentage immunoreactive area of total area for the immunohistochemical staining of IRAK-4, IRAK-1 and pIRAK-1 in CTRL (n=11) and AD (n=11) temporal cortex. * p<0.05. |