 |
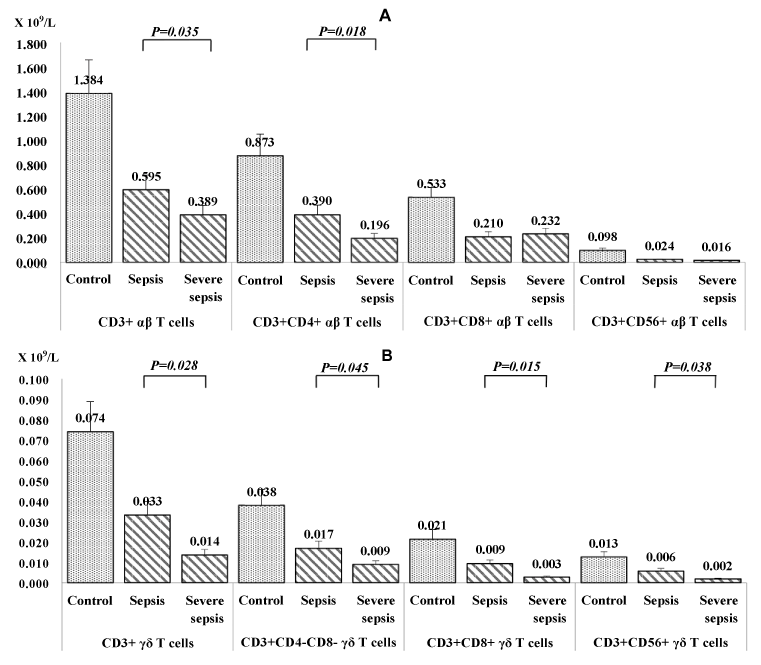
| Figure 2: Frequencies of T cells subsets according to type of receptor αβ (A) and γδ (B), in septic patients and control group. Values are expressed as means (××109/L) and T-bars denote standard deviation. Differences between control group and patients with sepsis (P<0.001). |