 |
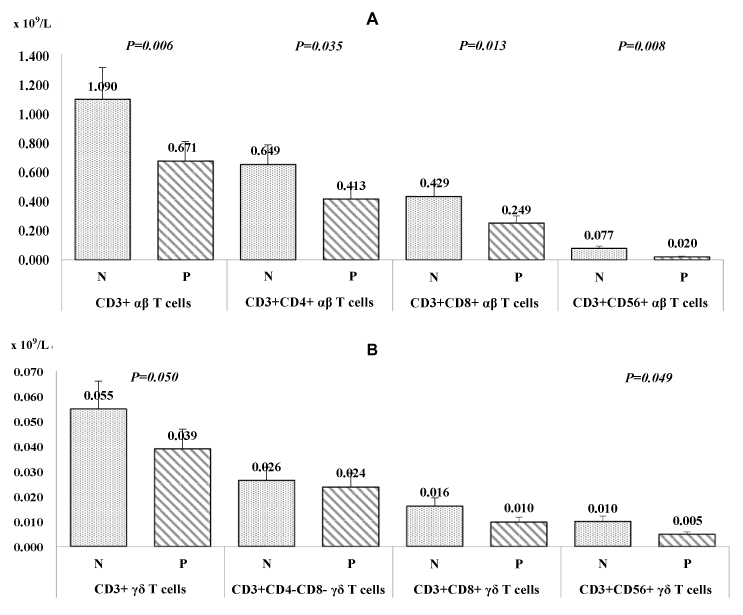
| Figure 3: Frequencies of αβ (A) and γδ (B) T cells in septic patients according to positive and negative IgE anti-Encephalitozoon cuniculi antibody levels. Frequencies are expressed as means (× 109/L) and T-bars denote standard deviation. N: Negative; P: Positive. Values higher than the mean of the Optical Densities (O.D.) of the serum samples plus once their standard deviation were considered as IgE positive. |