 |
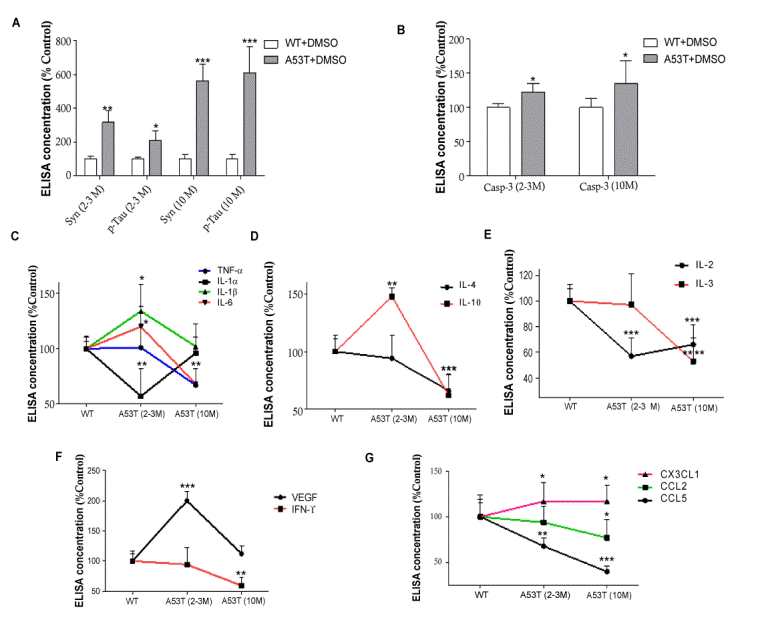
| Figure 1: Age-dependent alterations of brain immunity in A53T mice. Histograms represent ELISA levels of A) α-Synuclein and p-Tau in the brain of A53T mice, and B) shows caspase-3 activity in young and older mice. Graphs represent the levels of mouse A53T brain immune markers, including C) pro-inflammatory IL-1α, IL-1β, IL-6 and TNF-α, D) anti-inflammatory IL-4 and IL-10, E) modulators of immune memory IL-2 and IL3, F) VEGF and IFN-γ and G) chemokines CCL2, CCL5 and CX3CL1. n= 5 for each strain at each time point. ANOVA, Neuman Keuls, Mean ±, * indicates significantly different than WT with p<0.05, **p<0.01, ***p<0.001, **** p<0.0001. |