 |
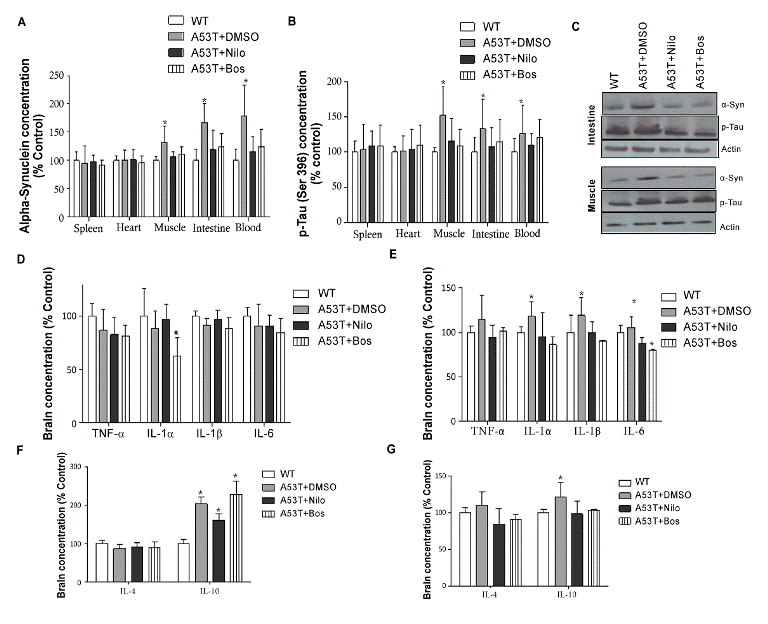
| Figure 3: Nilotinib and bosutinib decrease CNS and peripheral levels of α-Synuclein and p-Tau and modulate cytokine levels. Histograms represent ELISA levels of A) α-Synuclein and B) p-Tau in the spleen, heart, muscle, intestine and blood of A53T mice treated I.P with 10 mg/kg nilotinib or 5 mg/kg bosutinib or 3 μL DMSO every other day for 6 weeks. C) Western blot analysis on 10% S NuPAGE gel showing analysis of muscle and intestine homogenized in 1xSTEN buffer to compare nilotinib and bosutinib effects with DMSO in A53T mice. D) brain and E) blood levels of pro-inflammatory IL-1α, IL-1β, IL-6 and TNF-α. F) brain and G) blood levels of anti-inflammatory IL-4 and IL-10. n= 5 for each strain at each time point. ANOVA, Neuman Keuls, Mean±, * indicates significantly different than W, p<0.05. |