|
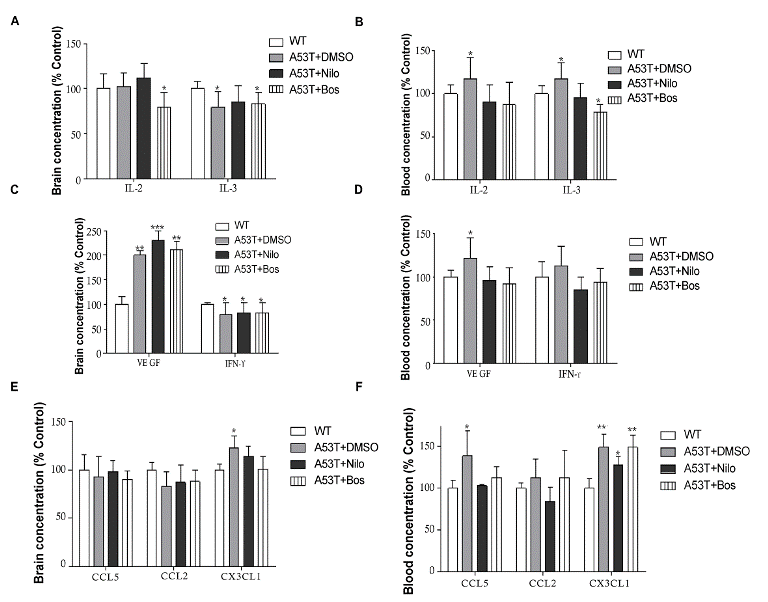
| Figure 4: Nilotinib and bosutinib modulate changes in the blood immunological profiles of A53T mice. Histograms represent ELISA levels in A53T mice treated I.P with 10 mg/kg nilotinib or 5 mg/kg bosutinib or 3 μL DMSO every other day for 6 weeks in A) brain and B) blood levels of modulators of immune memory IL-2 and IL3, C) brain and D) blood VEGF and IFN-γ and E) and F) blood levels chemokines CCL2, CCL5 and CX3CL1. n=5 for each strain at each time point. ANOVA, Neuman Keuls, Mean ±, * indicates significantly different than WT with p<0.05, **p<0.01. |