 |
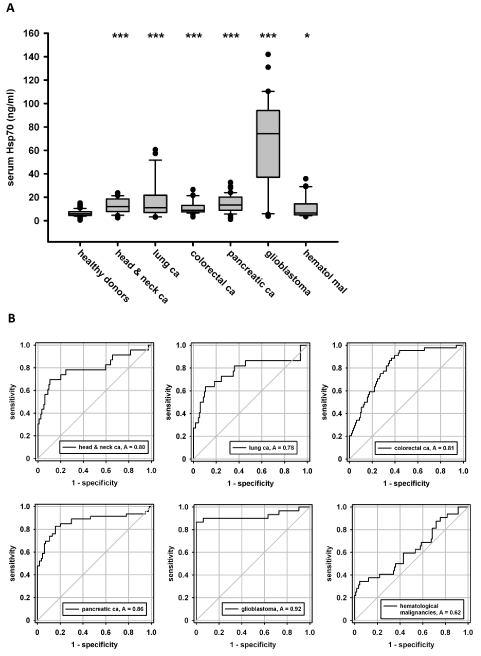
| Figure 6: Hsp70 serum levels in patients with different tumor entities compared to healthy controls. (A) Serum samples were taken from healthy human volunteers (n=114) and patients withsquamous carcinomas of the head and neck (n=23), lung cancer (n=22), colorectal cancer (n=44), pancreatic cancer (n=46), glioblastoma (n=30) orhaematological malignancies (n=32). Patient characteristics are summarized in Table 3. Significantly higher Hsp70 levels were found in all tumour patient cohorts compared to the healthy controls. Lines inside the box plots show the median value, upper and lower boundaries indicate the 25th and the 75th percentile, whiskersindicate the 10th and the 90th percentile, respectively. *p<0.05, ***p<0.001 (Mann-Whitney Rank Sum Test). (B) ROC curve analysis was performed on the data shown in (A). AUC, sensitivity and specificity data are summarized in Table 2. |