 |
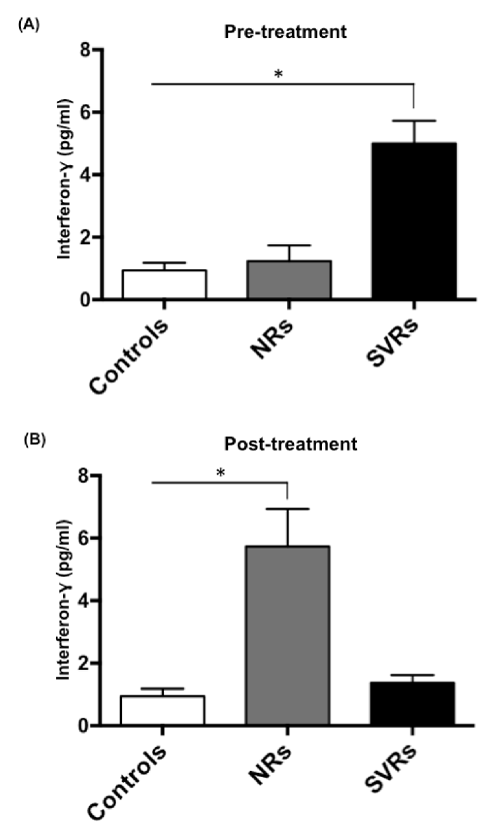
| Figure 7: SVRs secrete higher amounts of IFN-γ prior to IFN/RBV treatment. PBMCs from seronegative controls, NRs and SVRs were cultured for 24h and levels of various Th1/Th2/Th17 cytokines including IFN-γ were measured using Human Th1/Th2/Th17 Cytokine array (SA Biosciences, Qiagen). (A) Bar graph indicating the concentration of IFN-γ secreted by controls, NRs and SVRs (without any stimulation) at week 0, and (B) week 48 of treatment. P values were calculated using Student’s t test (* represents P<0.05). Error bars represent standard deviation. |