 |
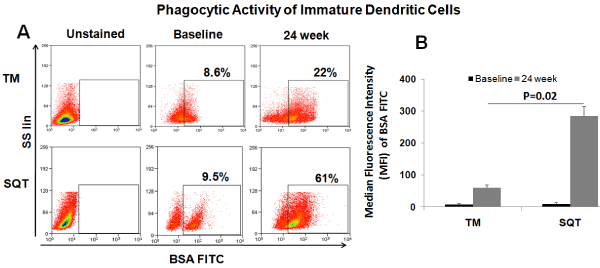
| Figure 2: Phagocytic Activity of Immature Dendritic Cells. (A) Representative dot plot showing BSA FITC uptake by dendritic cells at baseline and after 24 week of monotherapy or sequential therapy. Increased BSA FITC uptake was observed by dendritic cells in sequential therapy. (B) Increased median fluorescence intensity of BSA FITC molecule after 24 week of sequential therapy. |