 |
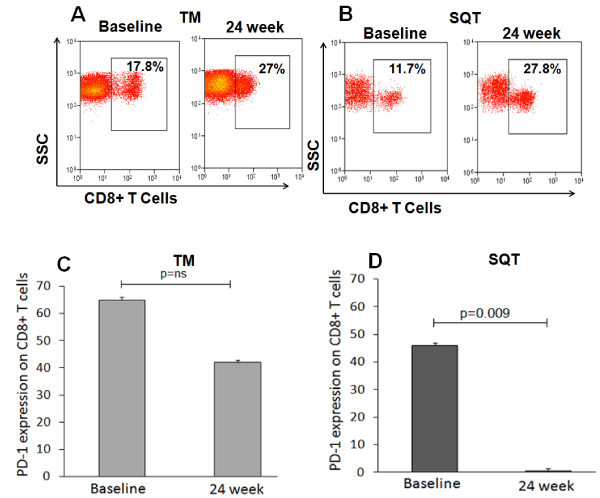
| Figure 4: Adaptive immune response during both therapies. (A-B) Representative dot plots showing no significant increase in the percentages of CD8+ T cells after 24 week of mono-therapy or sequential therapy. (C-D) PD-1 expression was analyzed during both therapies; with sequential therapy PD1 expression on CD8+T cells was decreased. |