 |
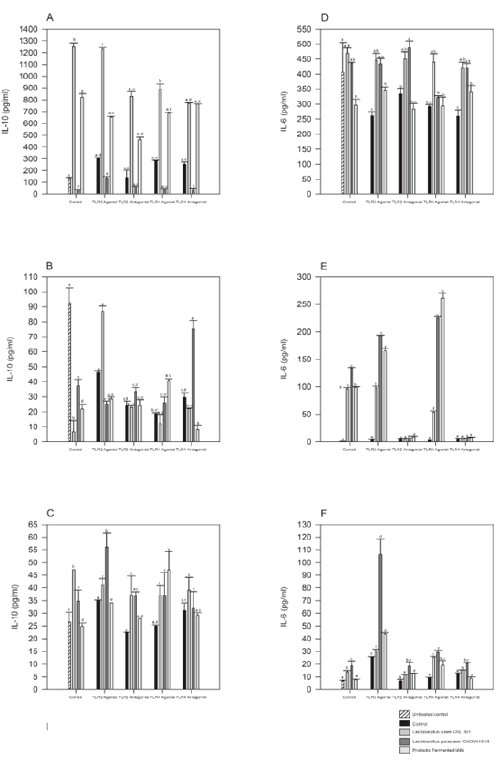
| Figure 2: Effects of TLR2 and TLR4 agonists and antagonists on cytokines production. In vitro effects of 20 μl at different concentrations, 1 μg/ml (TLR2 agonist), 10 μg/ml (TLR2 antagonist), 10 μg/ml (TLR4 agonist) and 10 μg/ml (TLR4 antagonist), after added L. casei CRL 431 (grey bar), L. paracasei CNCM I-1518 (dark-grey bar) and probiotic fermented milk (lightgrey bar), on the production of IL-10 and IL-6 by macrophages from BALB/c mice; macrophages unstimulated (black bar). (A-D) Peritoneal macrophages. (B-E) Peyer’s patches macrophages. (C-F) Spleen macrophages. a,b,c,dMeans values for peritoneum, Peyer’s patches and spleen macrophages without a common letter differ significantly (P<0.05). The error bars indicate standard deviations. |