 |
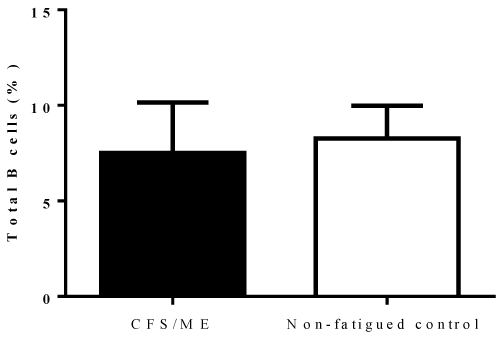
| Figure 4: B cell receptor complex in CFS patients and controls. Subset of B cells CD19+CD79a+CD79b+IgM+ significantly increased in the CFS group compared with non-fatigued group (p=0.037). The CFS group is represented in black while nonfatigued control group is represented in white, error bars indicate SEM. |