 |
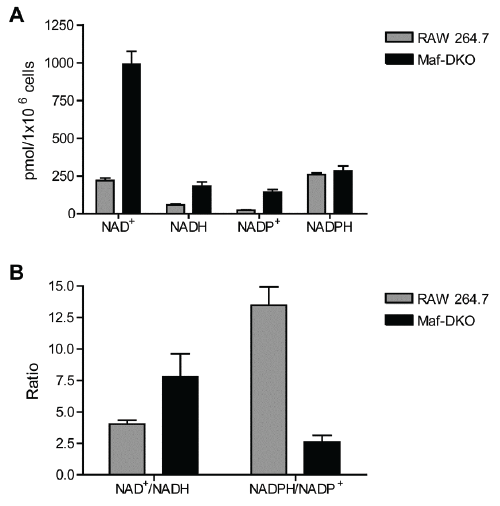
| Figure 4: Cellular NAD(H) and NADP(H) levels. A, Pyrimidine nucleotide concentrations, expressed as pmoles per 106 cells, were determined as described in Venter et al. [31]. Note that cell volume differs between RAW 264.7 and Maf-DKO cells (see text). Bars represent the mean ± SEM of all control values measured in three separate experiments (n = 12). B, NAD+/NADH and NADPH/ NADP+ ratios were calculated for every sample individually, using the control values referred to above (n = 12). |