 |
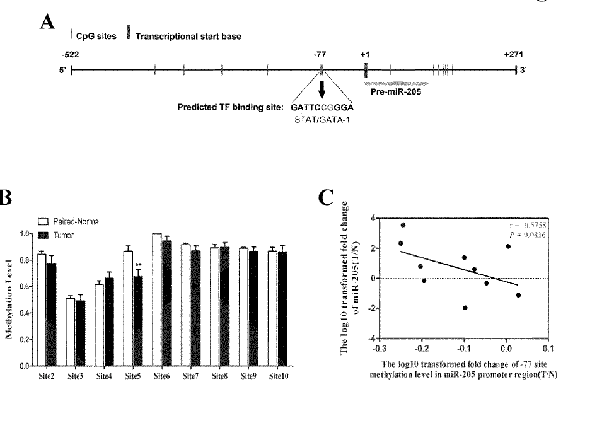
| Figure 4:DNA Methylation site in the promote region of miR-205 in human NSCLC tumor tissues. A. Schematic illustration of the -522~ +271 region in miR-205 promotor. B. Identification of CpG islandsin the promoter region of miR-205. A total of 22 pairs of NSCLC patient primary tumors and their normal counterparts were examined for the methylation status of miR-205 promoter region. C. Correlational analysis of promoter methylation and RNA expression for miR-205 in the paired patient tumor and normal tissue samples (T/N). X and Y axes represent log10 transformed fold change in methylation level and RNA expression, respectively. |