|
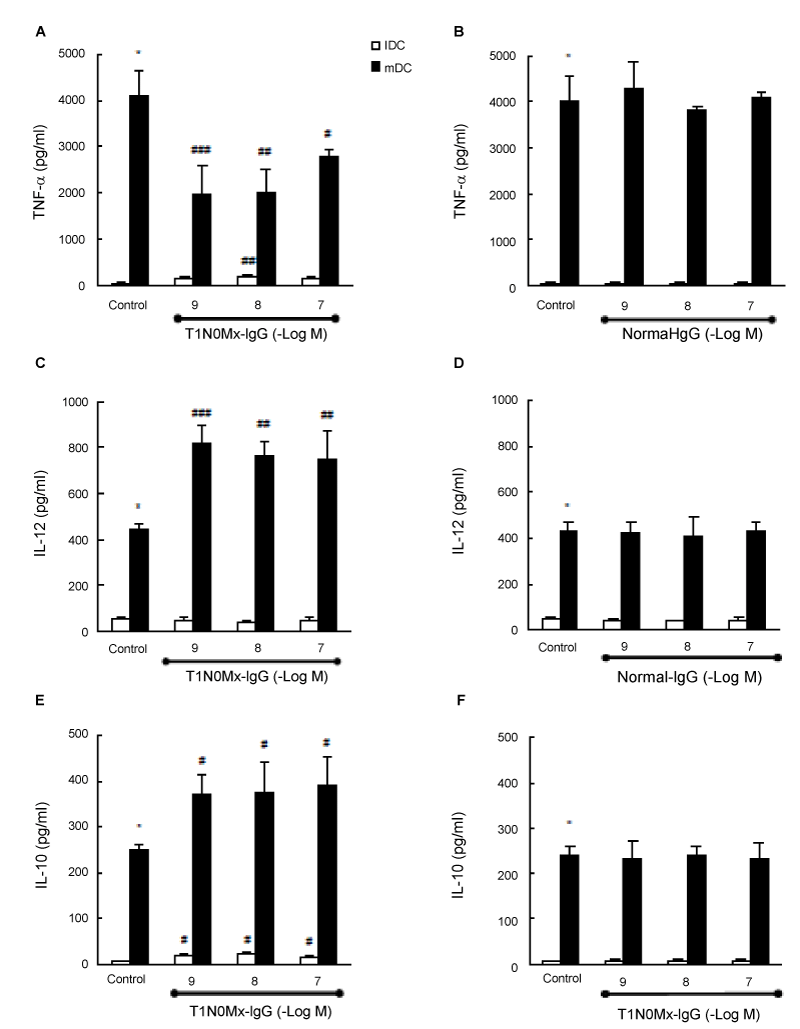
| Figure 3: Modulation of cytokine production by dendritic cells. Cells were obtained from human monocytes. Then, cells were cultured in the absence or presence of LPS (500 ng/ml) to obtain inmature (i) or mature (m) dendritic cells (DC) respectively. DC were stimulated during 1 h with different concentrations of T1N0Mx-IgG (A,C,E) or normal-IgG (B, D, F) to analyze TNF-α; IL-12 or IL-10 respectively in culture supernatants by ELISA. Data are expressed in picograms per milliliter (pg/ml) and represent the mean±S.E.M of 6 experiments. *p<0.0001 vs. iDC; #p<0.01; ##p<0.001; ###p<0.0001 vs. control iDC or mDC. |