|
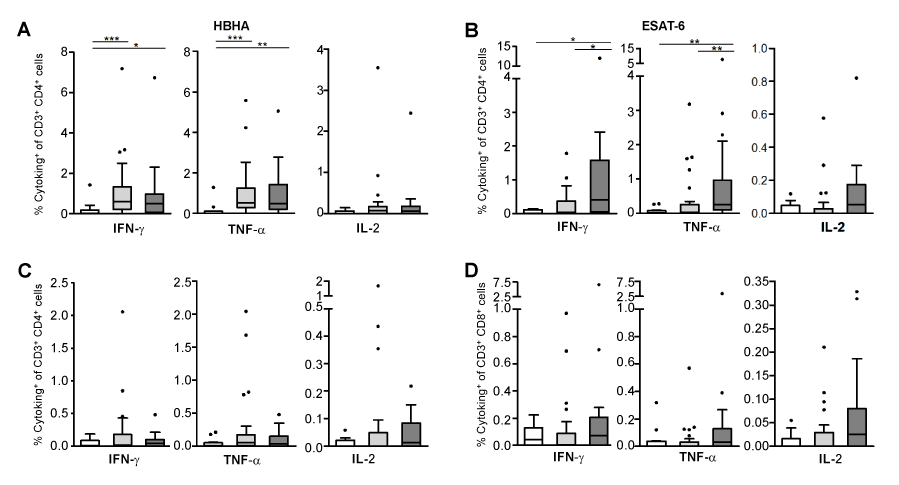
| Figure 2: Cytokine expression after long-term stimulation with M. tuberculosis antigens. Frequencies of IFN-γ-, TNF-α- or IL-2-expressing cells among CD3+CD4+ (A, B) or CD3+CD8+ (C, D) T cells in response to HBHA (A-C) or ESAT-6 (B, D) are represented. Uninfected controls (n=12), LTBI subjects (n=28) and TB patients (n=17) are represented by white, light grey and dark grey boxplots, respectively. Boxplots represent interquartile range (IQR), with whiskers (75th percentile + 1.5 IQR and 25th percentile – 1.5 IQR) and outliers (dots). Individual data were background subtracted before being summarized in the figures. *p ≤ 0.05; **p ≤ 0.01; ***p ≤ 0.001. |