|
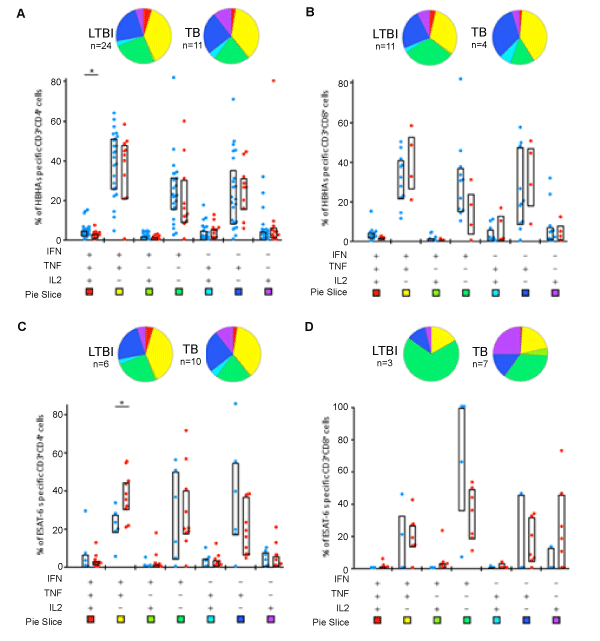
| Figure 3: Qualitative analyses of M. tuberculosis -specific CD3+CD4+ and CD3+CD8+T cell responses by polychromatic flow cytometry. Cytokine expression profiles of PBMC stimulated with HBHA (A, B) or ESAT-6 (C, D) were determined by the combined analysis of IFN-γ, TNF-α and IL-2. For all seven possible combinations of these cytokines shown on the x-axis, the frequencies among M. tuberculosis -specific CD3+CD4+ (A, C) and CD3+CD8+ (B, D) T cells are shown on the y-axis for LTBI subjects (blue) and TB patients (red). Subject subgroups were compared using the SPICE software: *p ≤ 0.05. Pie charts summarize the data, and each slice corresponds to the mean of the proportion of the M. tuberculosis -specific CD3+CD4+ or CD3+CD8+ T cells positive for each combination of expressed cytokines using the color-code shown below the x-axis. Results are shown for responders as defined in the methods section. |