|
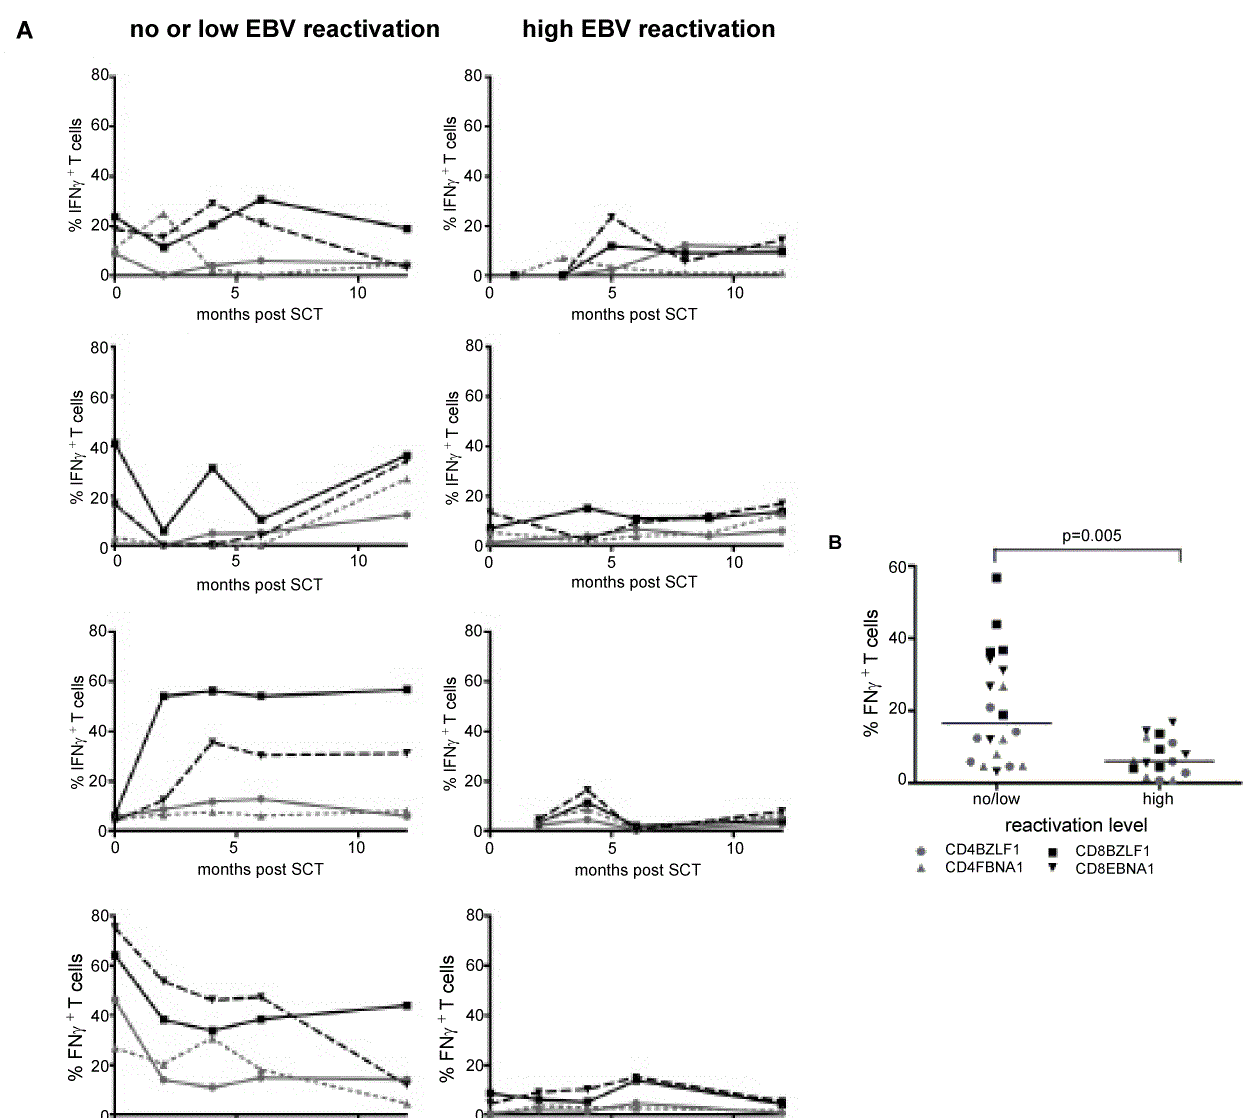
| Figure 3: T-cell functionality is impaired in patients with high-level EBV reactivations. Representative graphs of 4 patients without or with low EBV reactivation (left panel) and 4 patients with high-level reactivation. %IFNγ CD4+ or CD8+ T cells after PMA/ionomycin restimulation following BZLF-1 or EBNA-1 stimulation are depicted on y-axis. Months post SCT is depicted on x-axis. Percentages of IFNγ+ T cells at 1 year post SCT. Median percentages of IFNγ+ T cells are significantly higher 1 year post SCT in patient without or with a low viral reactivation (black squares: BZLF-1 stimulated CD8+ T cells; black triangles: EBNA-1 stimulated CD8+ T cells; grey circles: BZLF-1 stimulated CD4+ T cells; grey triangles: EBNA-1 stimulated CD4+ T cells) (p=0.005). |