 |
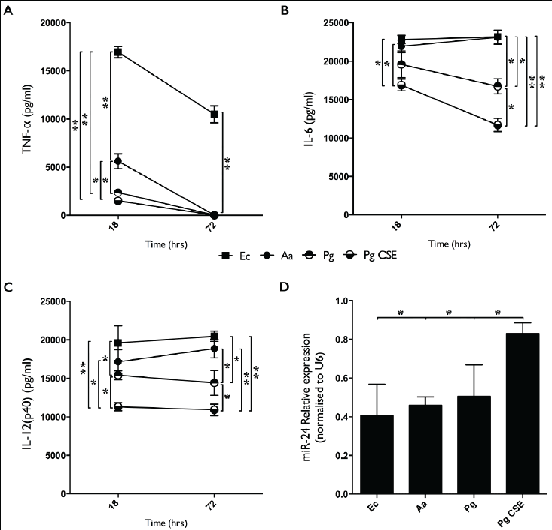
| Figure 1: Aa-, Pg, and Pg CSE-derived LPS display differing capacities to induce TNF-α, IL-6 and IL-12(p40) secretion and miR-24 downregulation in macrophages. A) TNF-α levels in the culture supernatant of macrophages stimulated with Aa-, Pg-, Pg CSE-, or Ec-LPS (all at 100 ng/ml) was assayed by ELISA after 18 and 72 h of stimulation. B) IL-6 levels assayed by ELISA. C) IL-12(p40) levels assayed by ELISA. D) miR-24 expression was assessed by RT-PCR after 18 h of stimulation. A, B, C=Mean values, error bars (standard deviation), and significance calculated by ANOVA). n=4 biological donors. D=Mean values, error bars (standard deviation), and signifi-cance calculated using Student’s ttest (two-tailed). n=3 biological donors. (*P<0.05, **P<0.001). |