 |
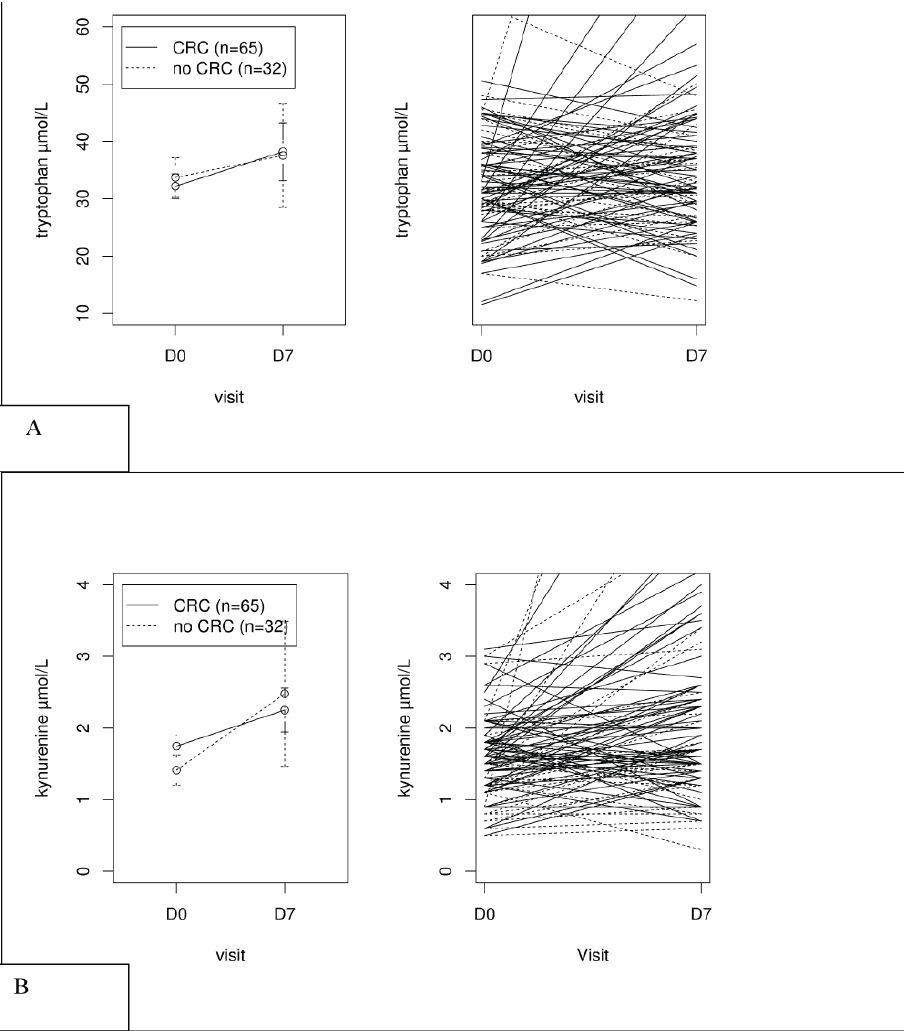
| Figure 2: Change in serum kynurenine (Figure 2A) and tryptophan (Figure 2B) concentration between D0 (prior surgery) and D7 (7 days after surgery). The parameter is expressed as mean and 95% confidence interval (left panel) and as spaghetti plot (right panel). |