|
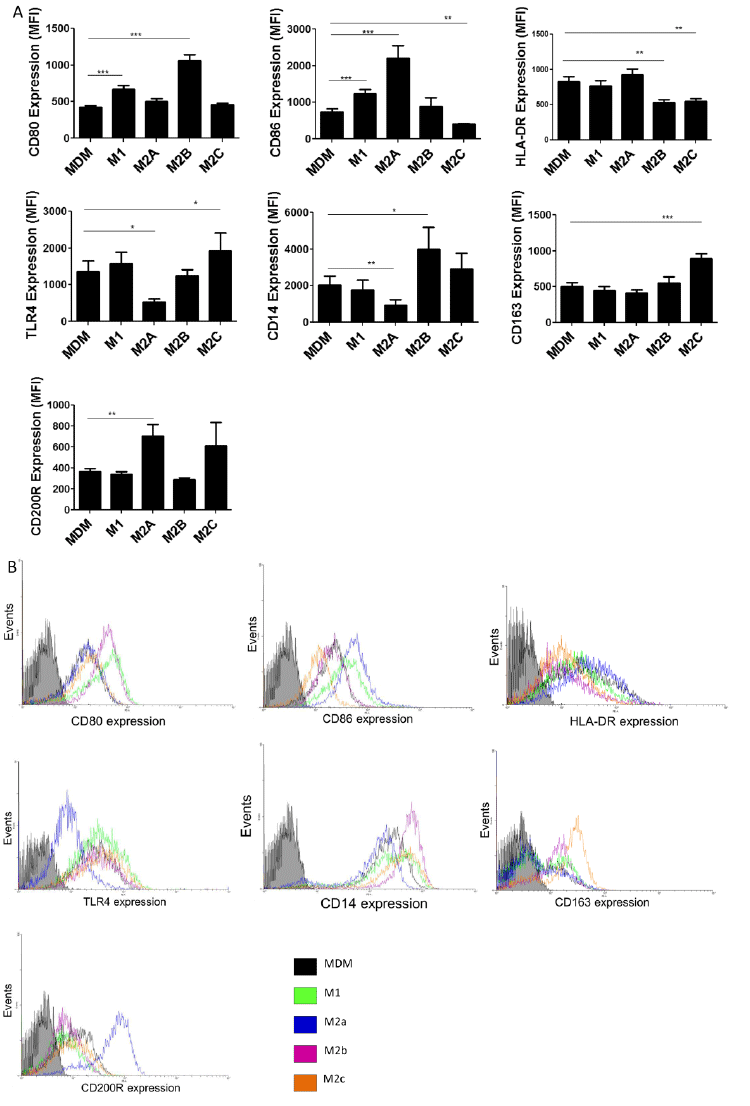
| Figure 1: Cell surface marker characterization of polarized macrophages. MDMs were polarized using indicated stimuli for 2 days: IFNγ (20 ng/ml) for M1 macrophages, IL-4 (20 ng/ml) for M2a macrophages, LPS (1 μg/ml) and IL-1β (10 ng/ml) for M2b macrophages and IL-10 (10 ng/ml) for M2c macrophages. Polarized macrophages were stained with antibodies against the mentioned cell surface molecules and fluorescence was measured by flow cytometry. MFI values (A) were obtained using FACSDiva software and histograms (B) from one representative experiment are shown. Bar graphs represent mean ± SEM, *p ≤ 0.05; **p ≤ 0.005; ***p ≤ 0.0005 with n=10 (CD80, CD86, HLA-DR, CD14, CD163 and CD200R) and n=4 (TLR4). |